Official STOCK Act disclosures

See what Congress is trading — straight from the filings

Every House and Senate stock trade, ranked by estimated return, with a full portfolio drawer for each member, net worth ranges and trade dates — for 2026 and 2025, one tap apart, on desktop or your phone.

Congressional Trades is a Full Desk feature: 7-day free trial (card required), then $79/month. Not included in the $19 Alerts plan. Cancel anytime.

109
members with 2026 trades
(83 House · 26 Senate)
4,022
2026 trades parsed
from official filings
8,515
2025 trades
(135 members)

Counts from the Oct 15, 2026 data snapshot; they grow as new filings are published.

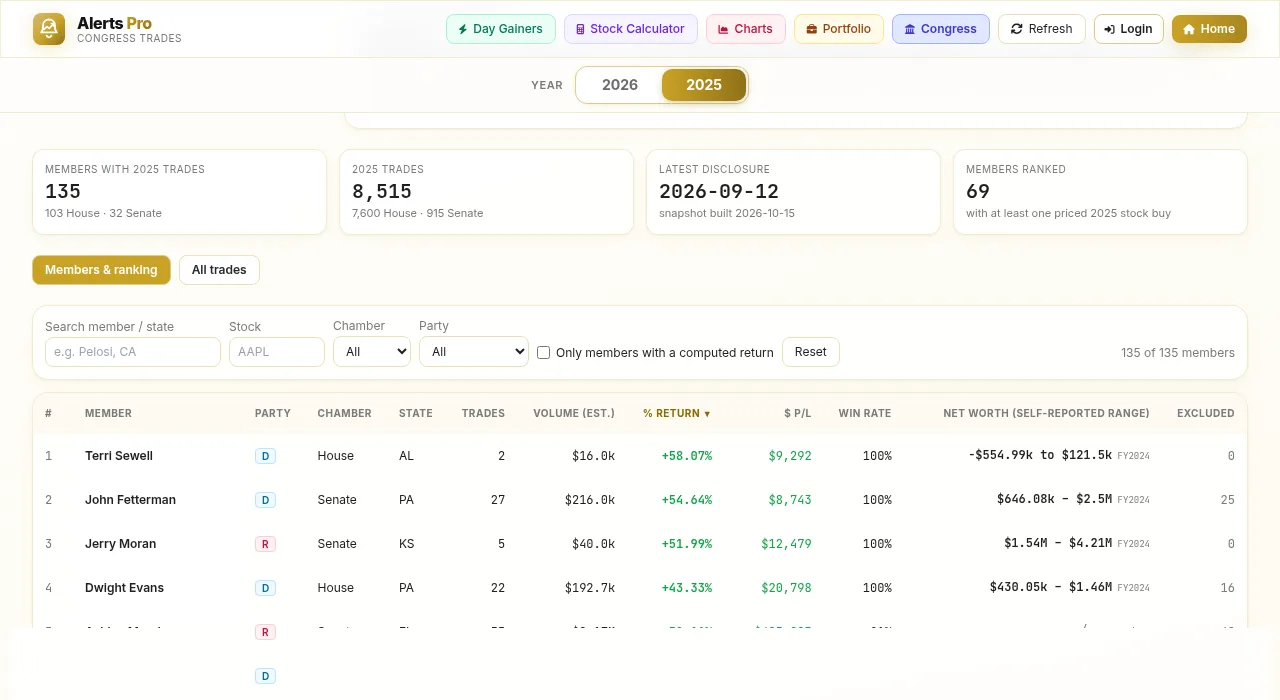
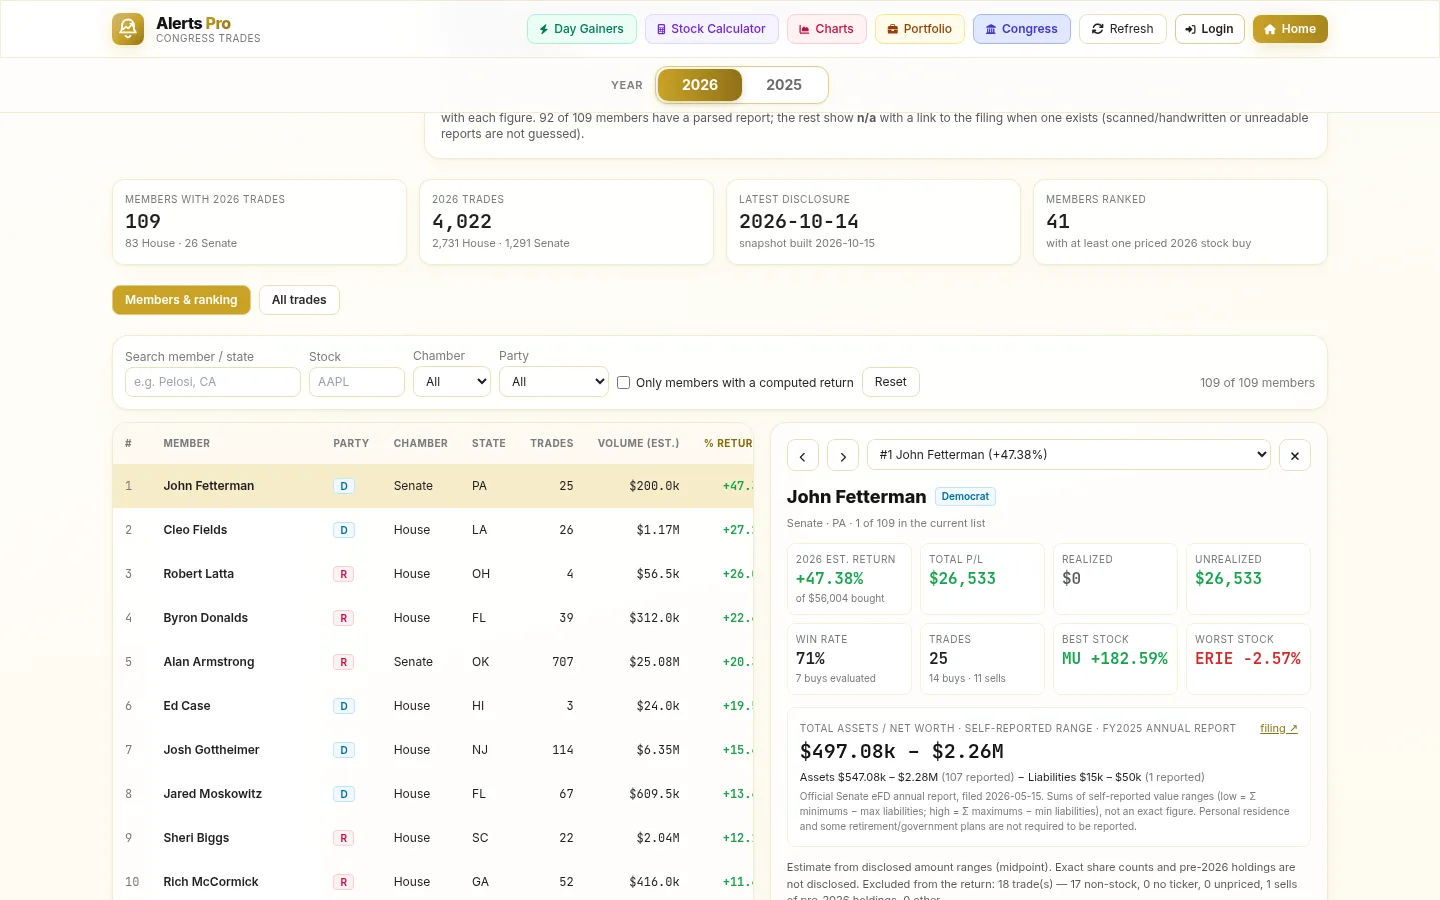
Congress ranking — real screenshot
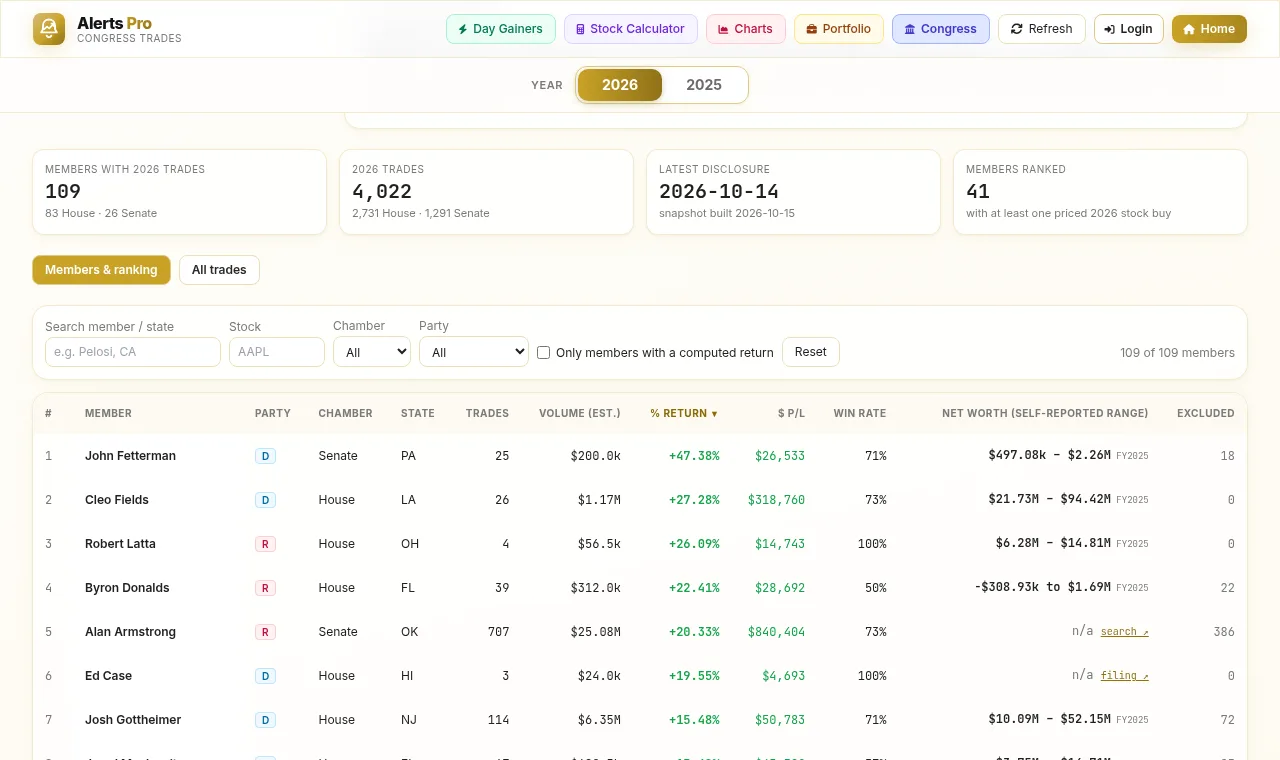
Congress ranking table with year toggle
Estimated returns from disclosed amount ranges (midpoint); not members' actual returns. Screenshot from the Oct 15, 2026 snapshot.
Inside Congressional Trades

Everything Congress discloses, in one place

Every member of Congress

All House and Senate members who filed a stock trade — not a hand-picked list. 109 members in 2026 so far and 135 in 2025 (as of the Oct 15, 2026 snapshot).

Straight from the official filings

Parsed from House Clerk periodic transaction reports and U.S. Senate eFD filings. Every row links back to its source filing.

2026 | 2025 in one tap

A year toggle switches the ranking, member drawer, all-trades tab, coverage notes and methodology together. Each year is cached, so switching back is instant.

Ranked by estimated % return

See who has the highest estimated return on their disclosed stock trades. Sort by return, $ P/L, win rate, trades, volume, party, chamber or state.

Member portfolio drawer

Click a member for per-stock positions: cost basis, price, realized and unrealized P/L in $ and %, status, best and worst stock, and a gain/loss bar.

Net worth ranges

Total assets and net worth shown as a range from each member's official annual Financial Disclosure, with the filing year. Marked n/a (with a link) when a report can't be read.

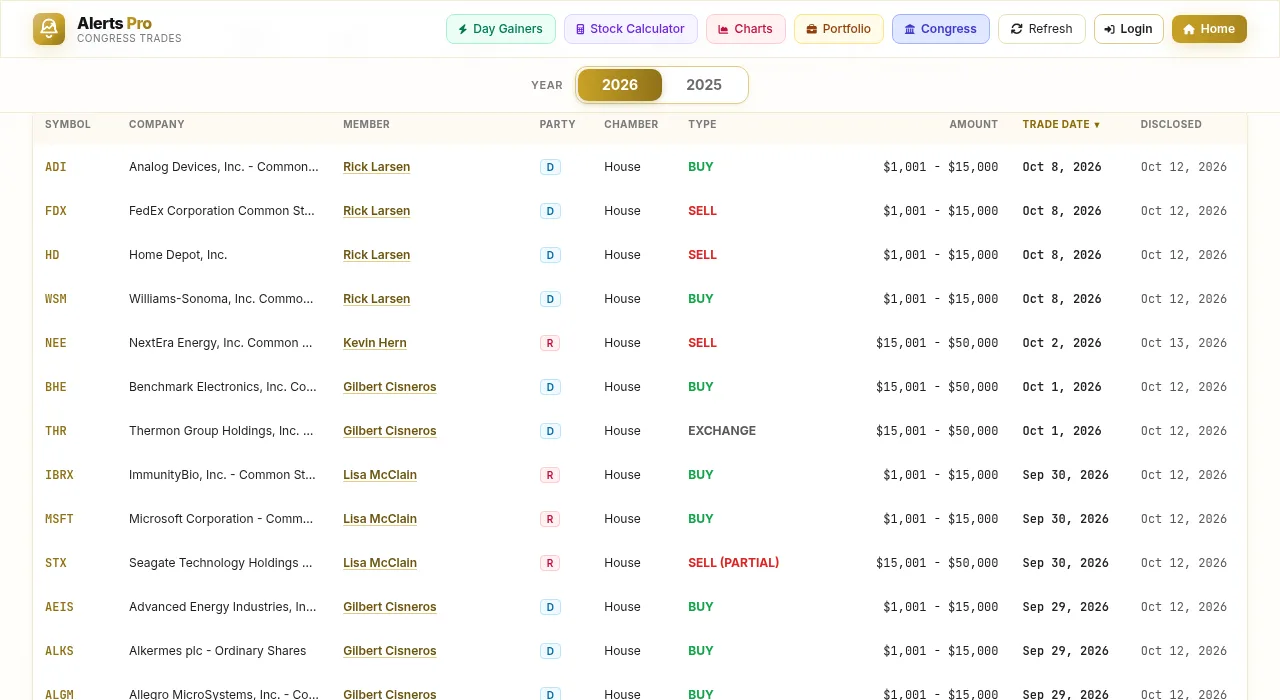
Trade dates, newest first

The date each trade was actually made (with the filing date underneath), sortable, in every member's trade list and in the all-trades tab.

All-trades tab, one click to the member

Every disclosed trade across Congress in one sortable, filterable table. Click any member's name to open their full drawer.

Built for your phone

Frozen first column, fixed-height rows and a full-screen member drawer. The year toggle stays pinned at the top on mobile.

Kept up to date

Data is rebuilt from the official sources on a regular refresh and the page shows when the snapshot was built and the latest disclosure date.

How it works

From official filing to your screen

1

We collect the filings

House Clerk periodic transaction reports (PDF) and Senate eFD reports, straight from the official sites. Scanned paper filings that can't be read are listed, never guessed.

2

We normalize every trade

One schema for House and Senate: member, party, state, owner, asset, ticker, buy/sell, trade date, filing date, amount range and source link. Rows that fail validation are rejected.

3

We estimate returns

We replay each member's disclosed trades at the midpoint of the amount range using daily closing prices, with open positions marked to the latest price (or Dec 31 for 2025).

4

You explore

Rank, filter and sort members, open a portfolio drawer, scan all trades, check net worth ranges, and flip between 2026 and 2025.

On your phone

Congress in your pocket

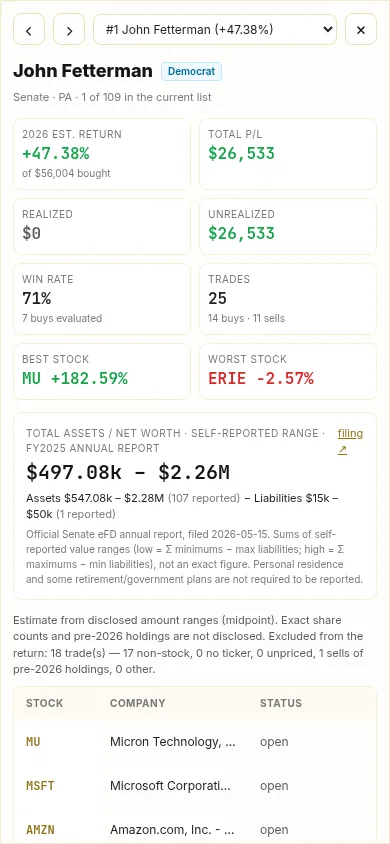
Phone screenshot of a member drawer
Member drawer with net worth range
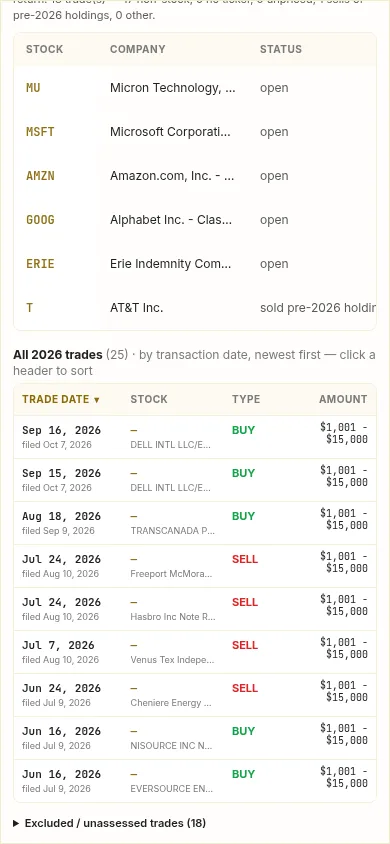
Phone screenshot of a member trade list sorted by trade date
Trades by date, newest first

Honest answers

Questions, answered straight

Is this financial advice?

No. Alerts Pro Congressional Trades is educational and informational. It is not investment advice or a recommendation to buy or sell any security. Past trades by members of Congress do not predict future results.

How current is the data?

Members have up to 45 days after a trade to file a disclosure (and sometimes file late), so the data always lags the real trades. The page shows the latest disclosure date and when the snapshot was built.

Are the returns real?

They are estimates. Members disclose amount ranges (for example $15,001 – $50,000), not exact amounts or share counts, so we use the midpoint of each range. Returns are not the members' actual portfolio returns. Pre-year holdings, options, bonds, funds and unpriceable assets are excluded and counted.

Where does the data come from?

The House Clerk's periodic transaction reports and annual financial disclosures, and the U.S. Senate eFD site. Party, state and member IDs come from the open unitedstates/congress-legislators dataset, and prices from daily closes.

What about net worth?

Net worth is shown as a range summed from the self-reported asset and liability ranges in each member's latest official annual report, with the filing year. It excludes things members aren't required to report (such as a personal residence), and some reports are shown as n/a with a link to the filing.

Does it cover every trade?

It covers every filing we can parse. Scanned or handwritten paper filings are not read and are listed as unparsed. Some stock rows have no resolvable ticker or no price data, and those are excluded from returns (the page tells you how many).

Which plan includes it?

Congressional Trades is a Full Desk ($79/month) feature. It is not included in the $19 Alerts plan. Full Desk starts with a 7-day free trial (card required), and you can cancel anytime.

Full Desk

$79/ month

Start your 7-day free trial — card required, cancel anytime.

Congressional Trades is included with Full Desk only — along with Home alerts, Day, Swing, Charts, Calculator and Portfolio. It is not part of the $19 Alerts plan.

Start free trial

Secure checkout via Stripe.